3Q2021 Housing Trends

3Q2021 Housing Trends

  • Brian MacDonald
  • November 24, 2021

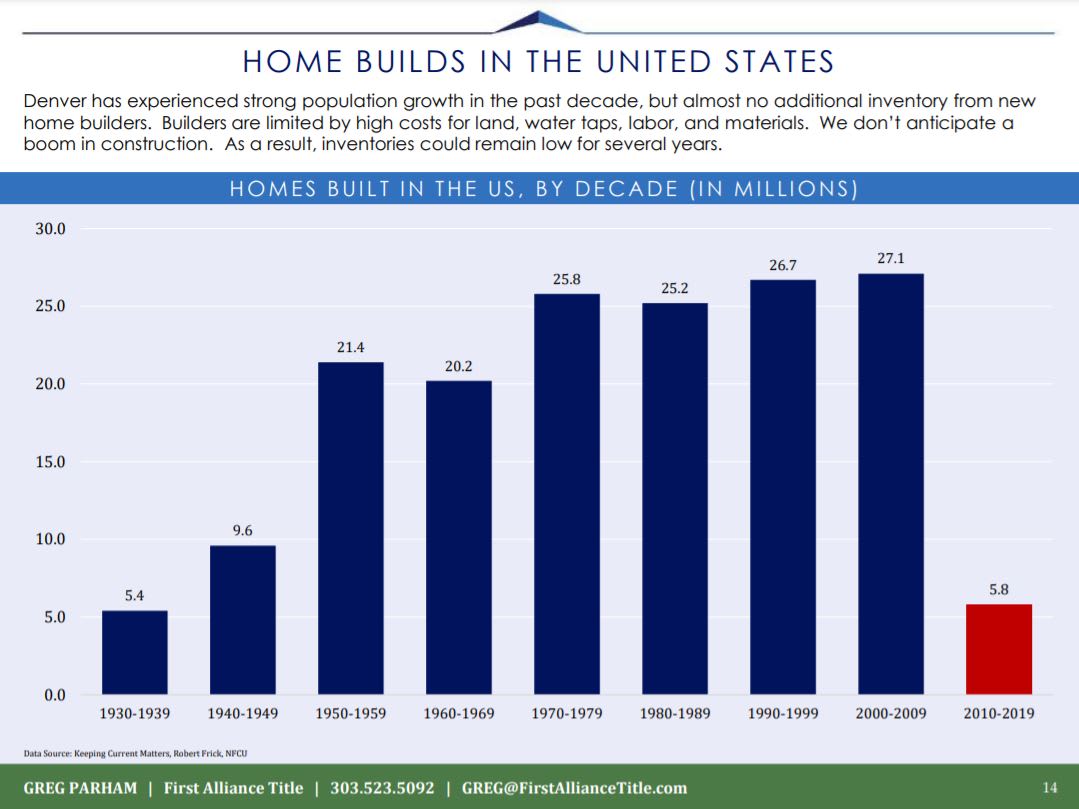
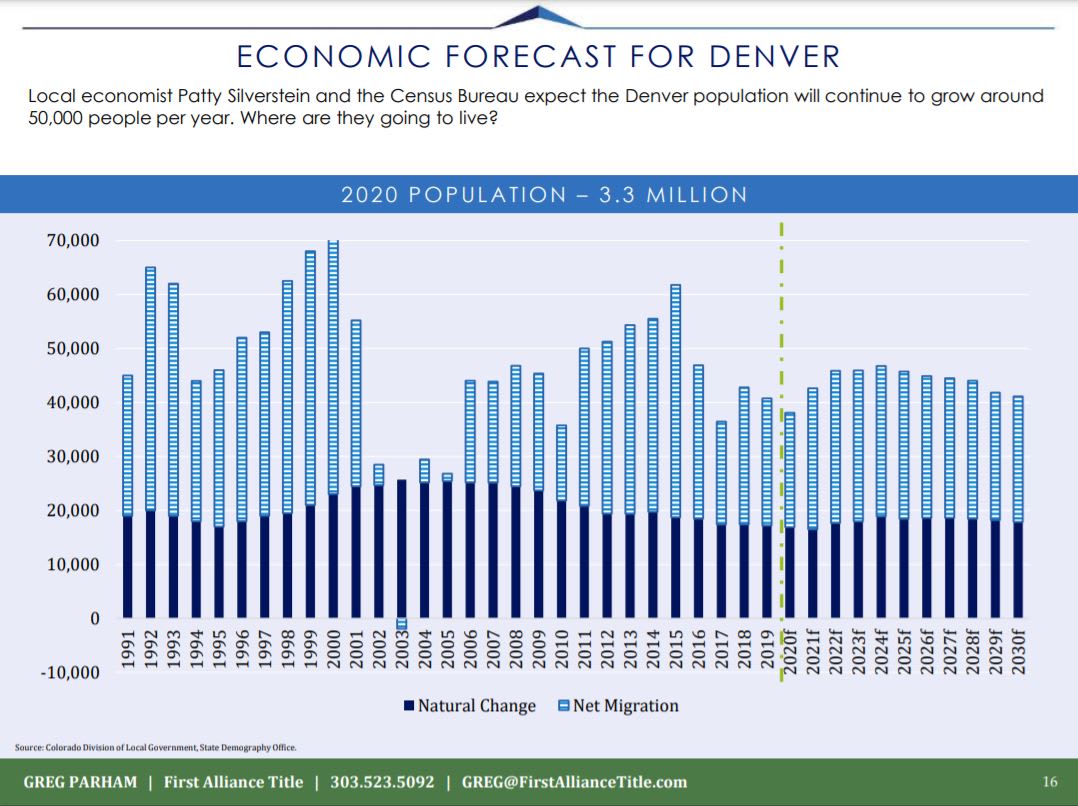
All statistics point towards continued long-term strong seller's market. Denver is experiencing ~50,000 net incoming migration, mortgage loans are solid with no impending default trend, and builders have underbuilt demand for the last decade (check out slide 14). Here are selected key slides of this recent report.
3rd Quarter 2021 Home Trends banner featuring a modern house among autumn trees.

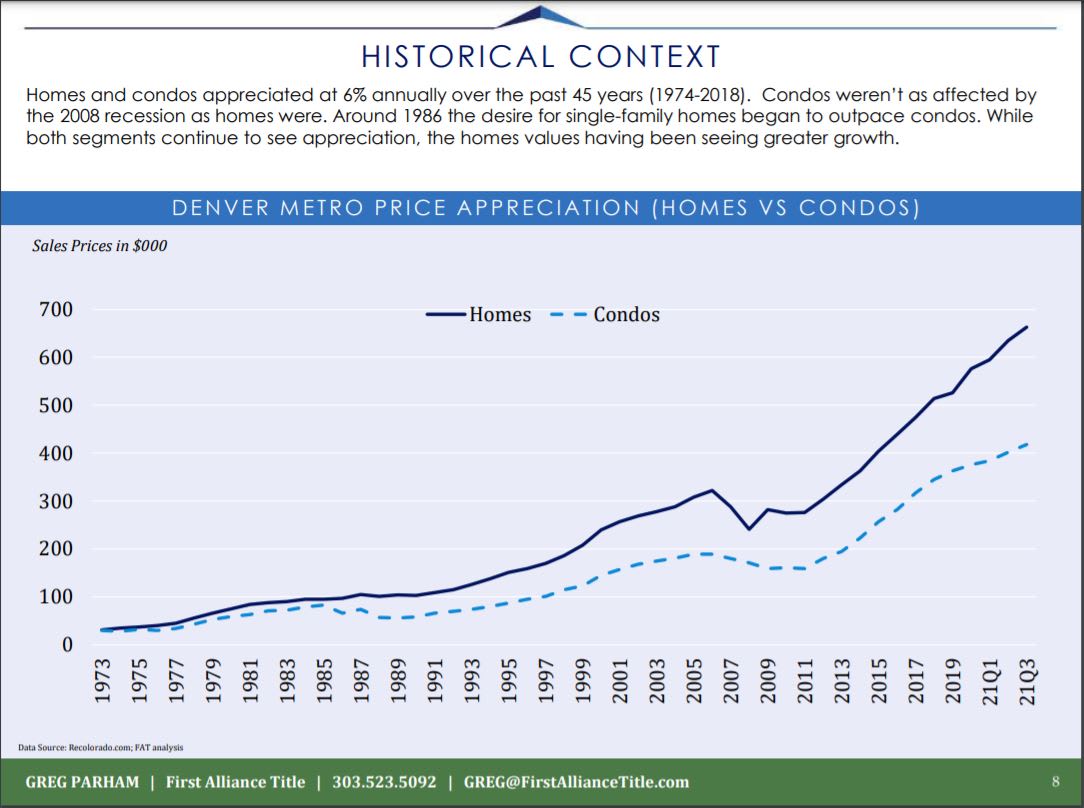
Denver metro home and condo price appreciation chart, with home prices rising faster through 2021.

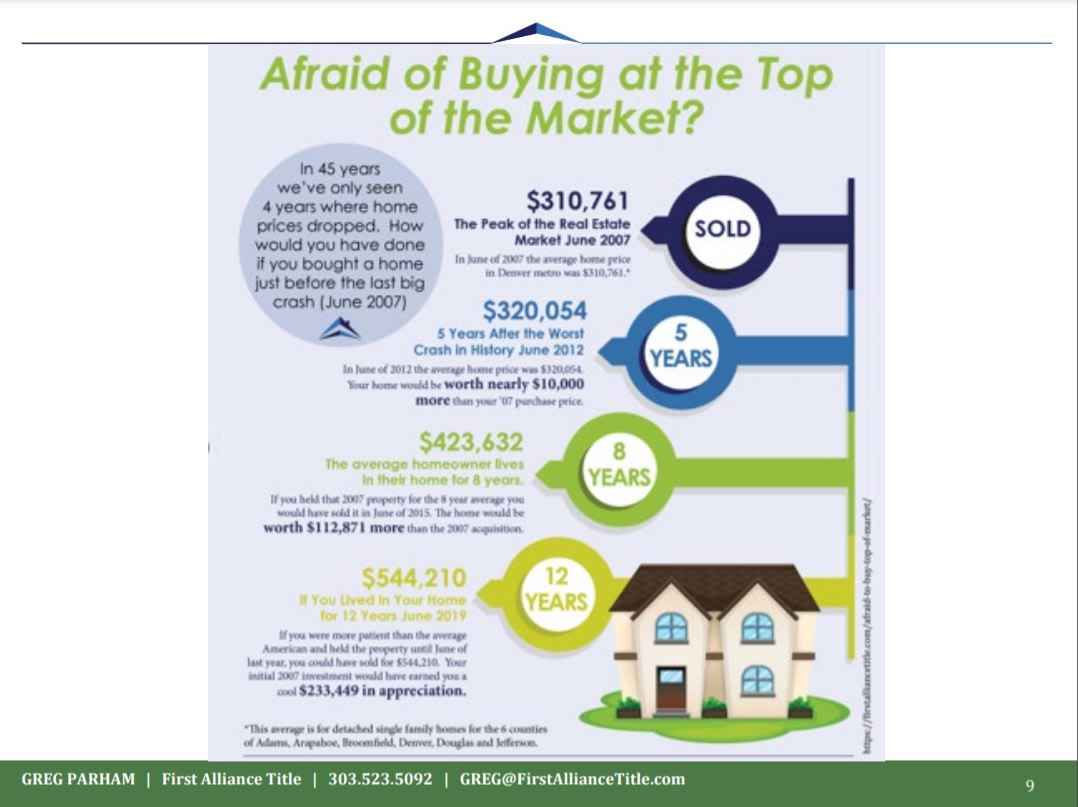
Housing trends infographic comparing Denver-area home prices over five, eight, and twelve years.

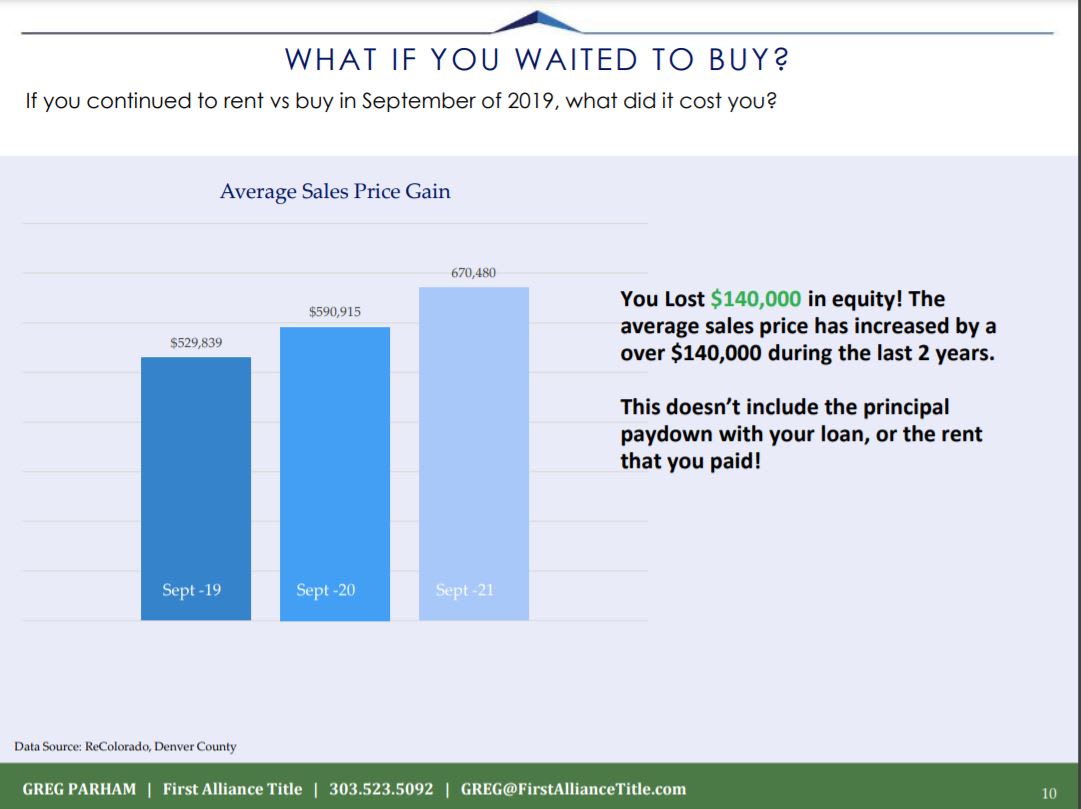
Housing trends infographic compares rising Denver County sales prices from September 2019 to September 2021.

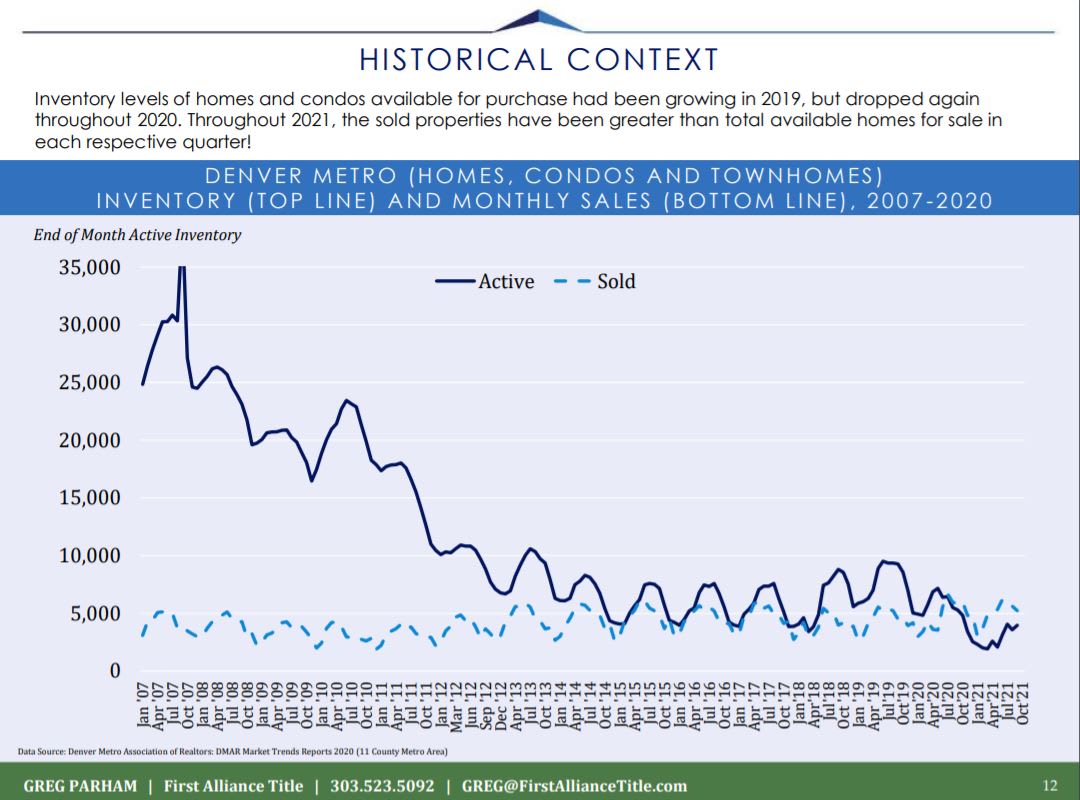
Chart comparing Denver metro active housing inventory and monthly sales from 2007 to October 2021.

Bar chart of US homes built by decade, peaking at 27.1 million in 2000–2009; 2010–2019 shows 5.8 million.

Denver population growth chart showing natural change and net migration from 1991 to 2030.


Work With Brian

Have questions about moving? Buying or selling a property?